

Collaborative Value Chains for the Green Transition
Introducing the Collaborative Value Chains Explorer
Welcome to the Collaborative Value Chains Explorer, a non-profit, public-purpose project of i3T and RubidiumData. This page explains why we built the explorer and how it works.
The green transition requires collaborative industrial strategies
Accelerating the transition toward a green economy requires solving multiple problems at once. Rapid build-out of clean energy infrastructure and its inputs requires efficient coordination across value chains. Securing buy-in for the green transition requires building win-win solutions for workers, communities, and firms. Overcoming economic dependencies implies pairing the green transition with (re-)industrialization and technological development.
But what does efficient coordination look like? How can governments collaborate to build mutually beneficial and sustainable value chains?
While general policy proposals for collaborative strategies abound, translating proposals into concrete policy implementation requires actionable data.
Effective collaborative strategies require robust data infrastructures
Our approach begins with technological-industrial value chain analysis.
Rather than starting from standardized trade and economic statistics with inherently low resolution, our approach begins with our rigorous, AI-powered technological decomposition of value chains to capture real-world industrial dynamics.
We map technologies and value chains at the component level before connecting each node to firms, skills, prices, intellectual property, employment, and much more.
Based on our fundamental technological layer, our tools also aggregate fine-grained data into the trade, product, and activity classifications used in standard industrial and trade analysis. Though these analytical approaches are less actionable, they also generate helpful exploratory insights, which we are now making publicly available for several value chains.
The Collaborative Value Chains Explorer
Our new beta visualization dashboard allows users to explore opportunities for collaborative industrial strategies across several value chains, rooted in our rigorous technological-industrial analysis. While our bespoke tools allow for more granular and high-fidelity assessment of current and potential productive capabilities, our new public dashboard also provides useful approximations by mapping trade data to our detailed technology graphs.
-
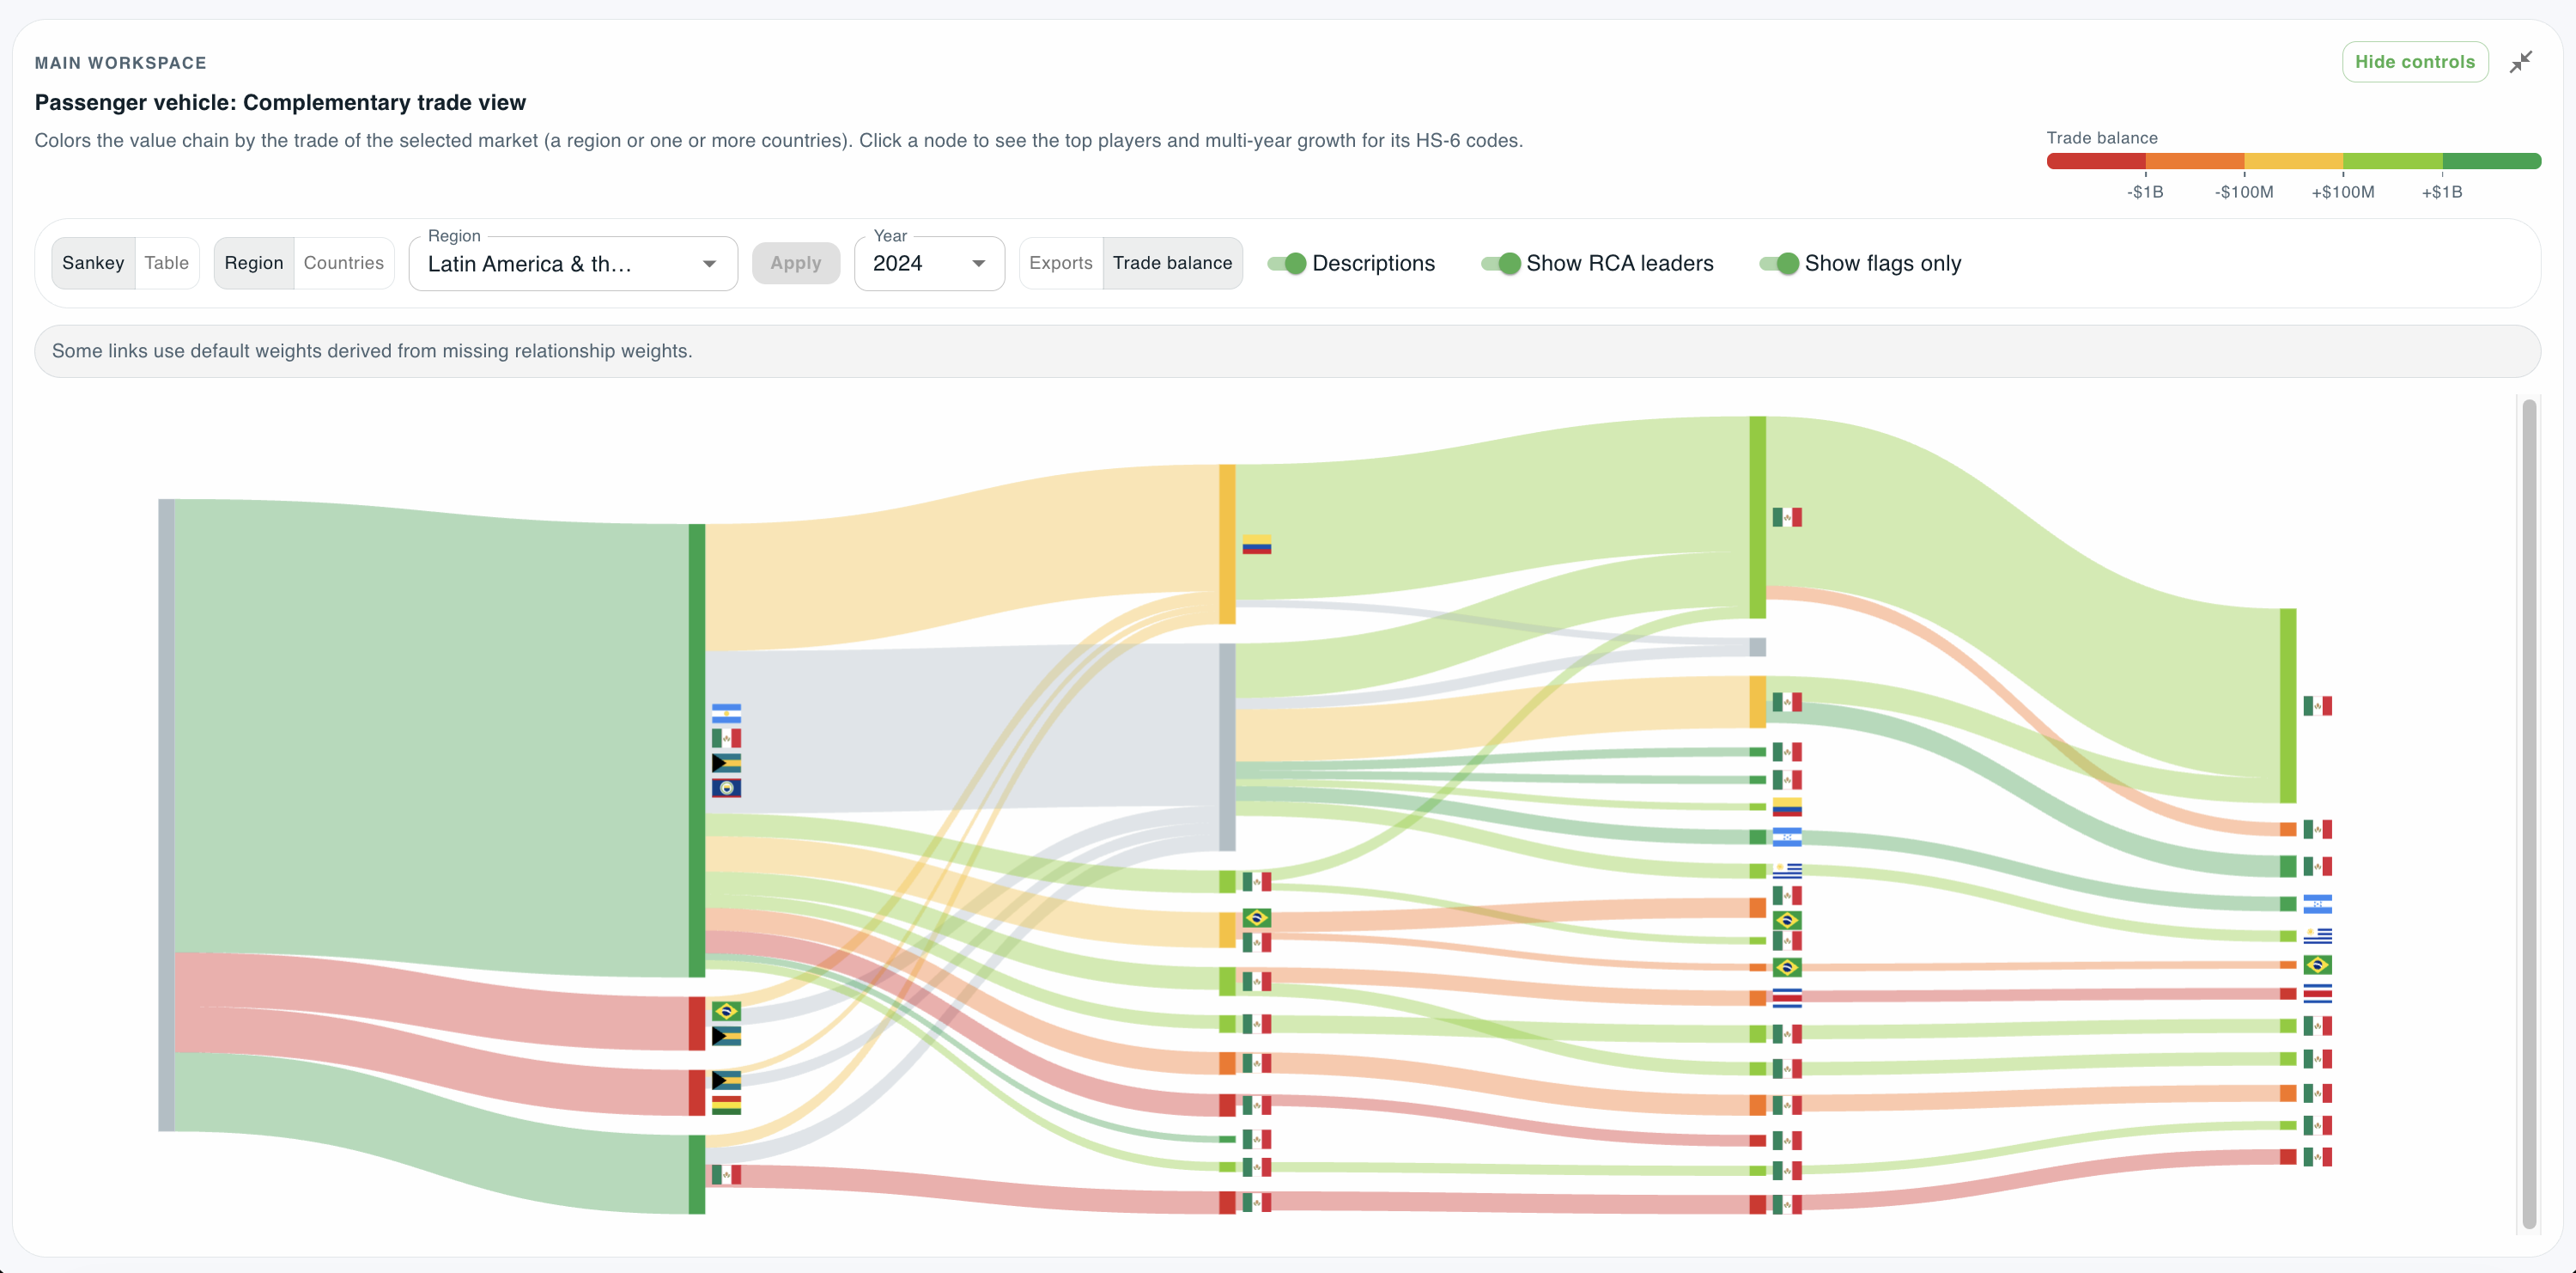
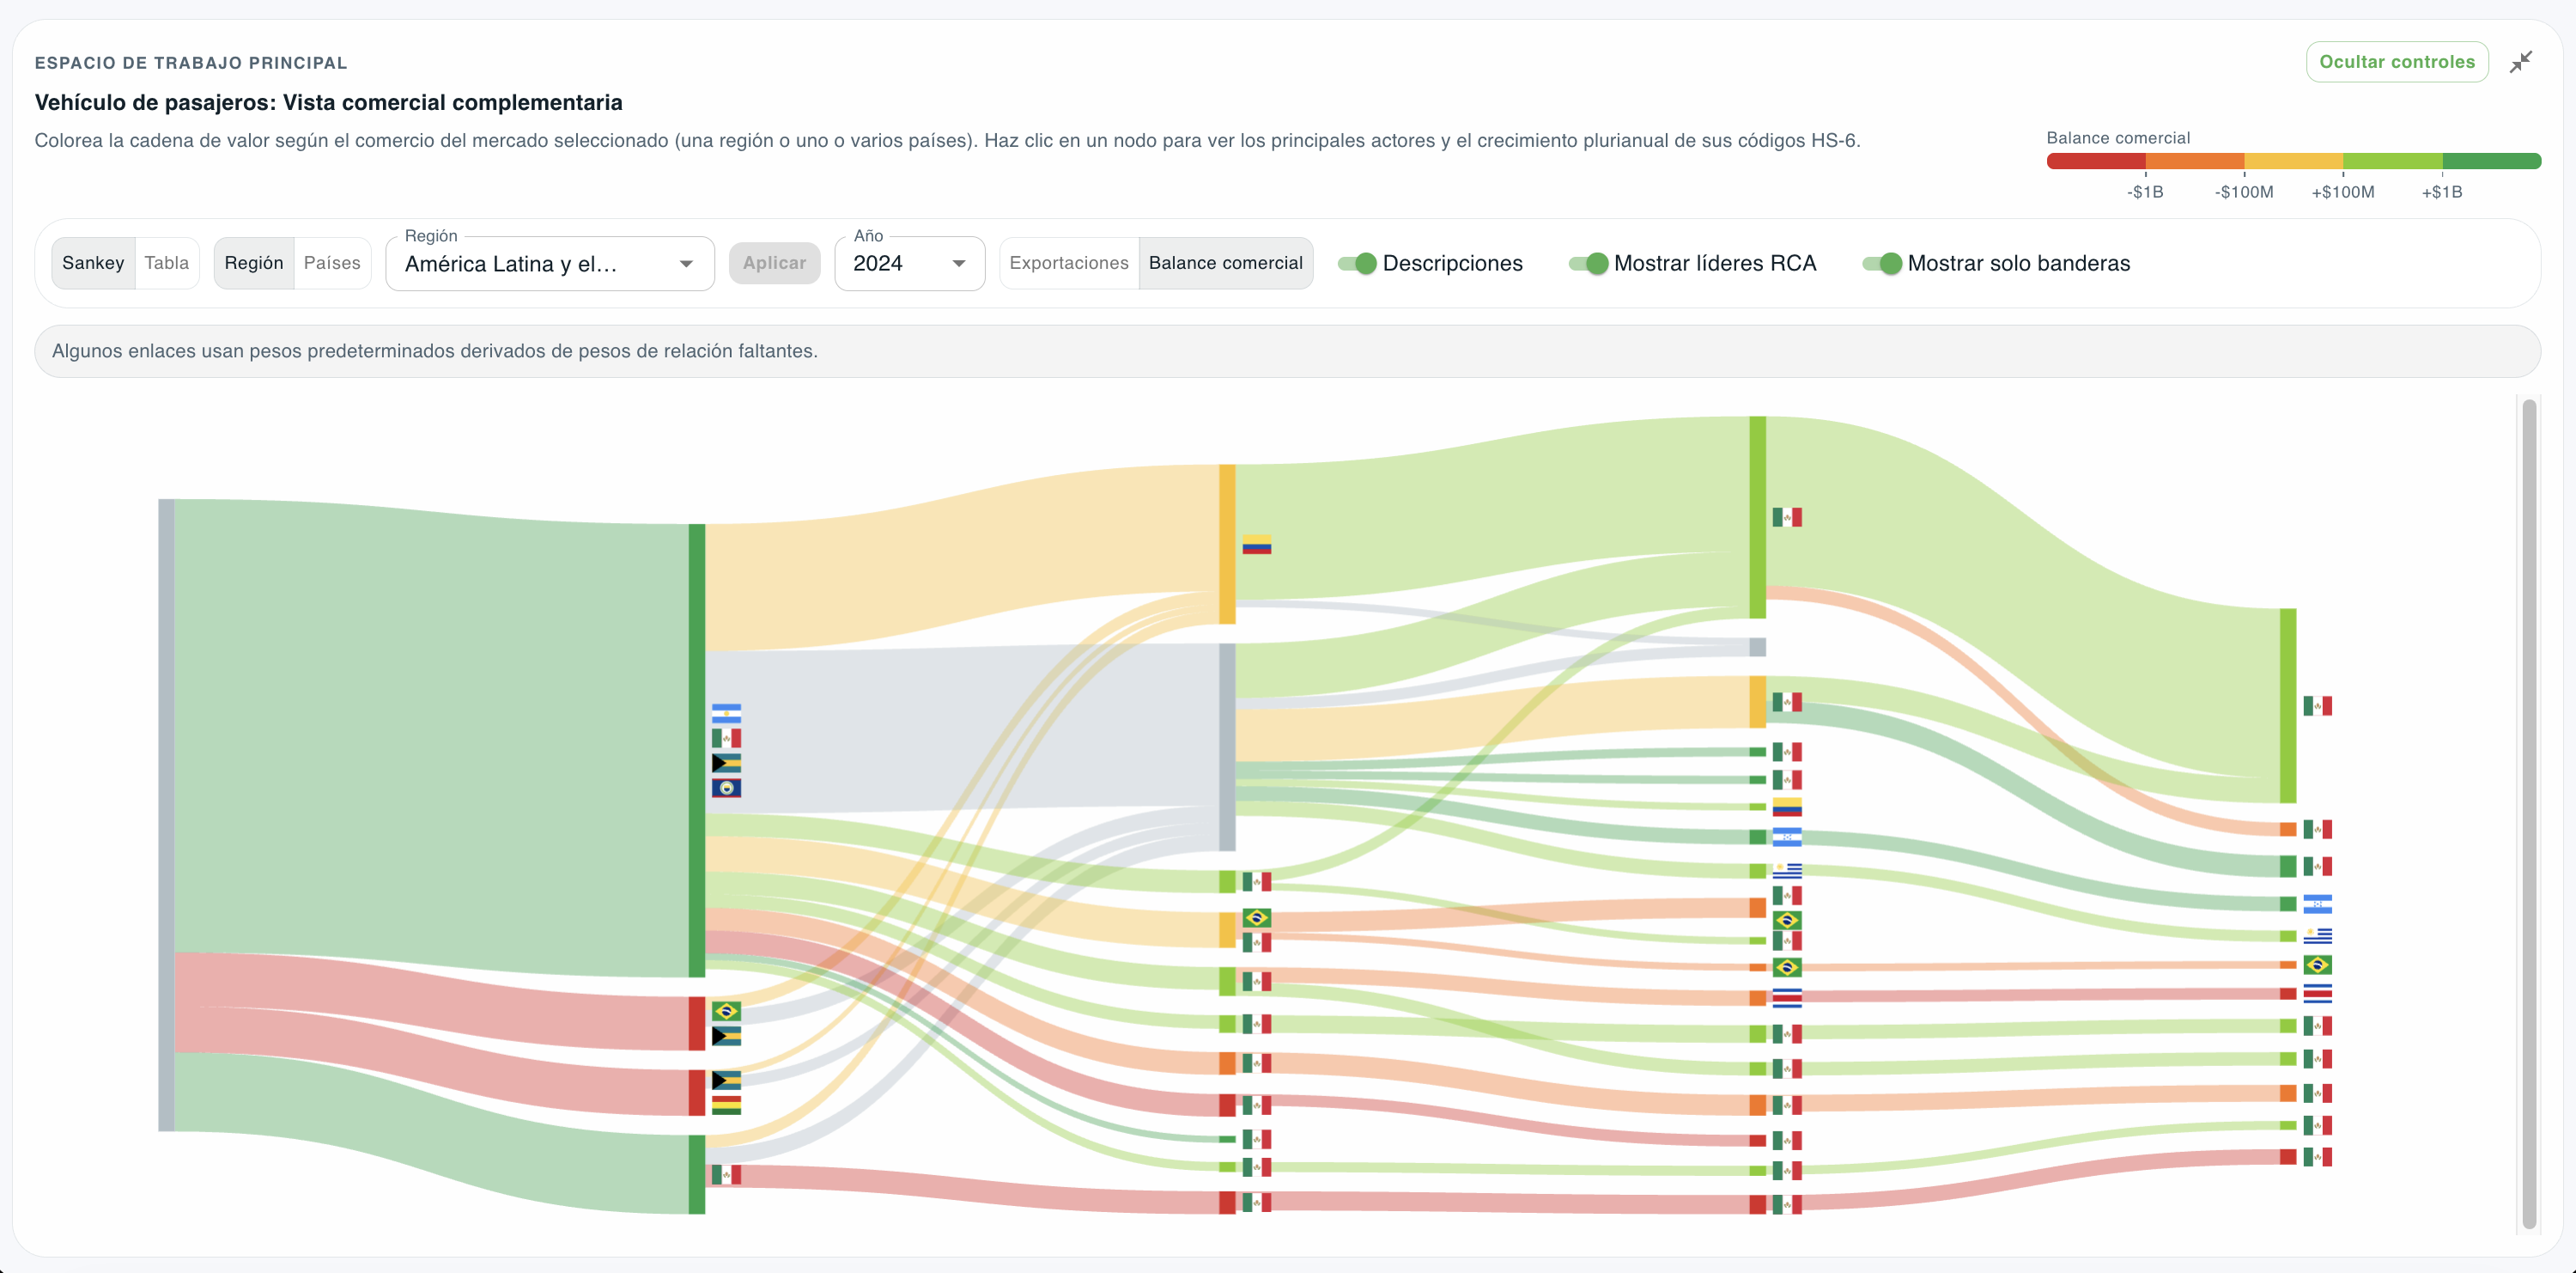
The passenger vehicle chain, coloured by Latin America’s trade balance node by node. 1 / 4 -
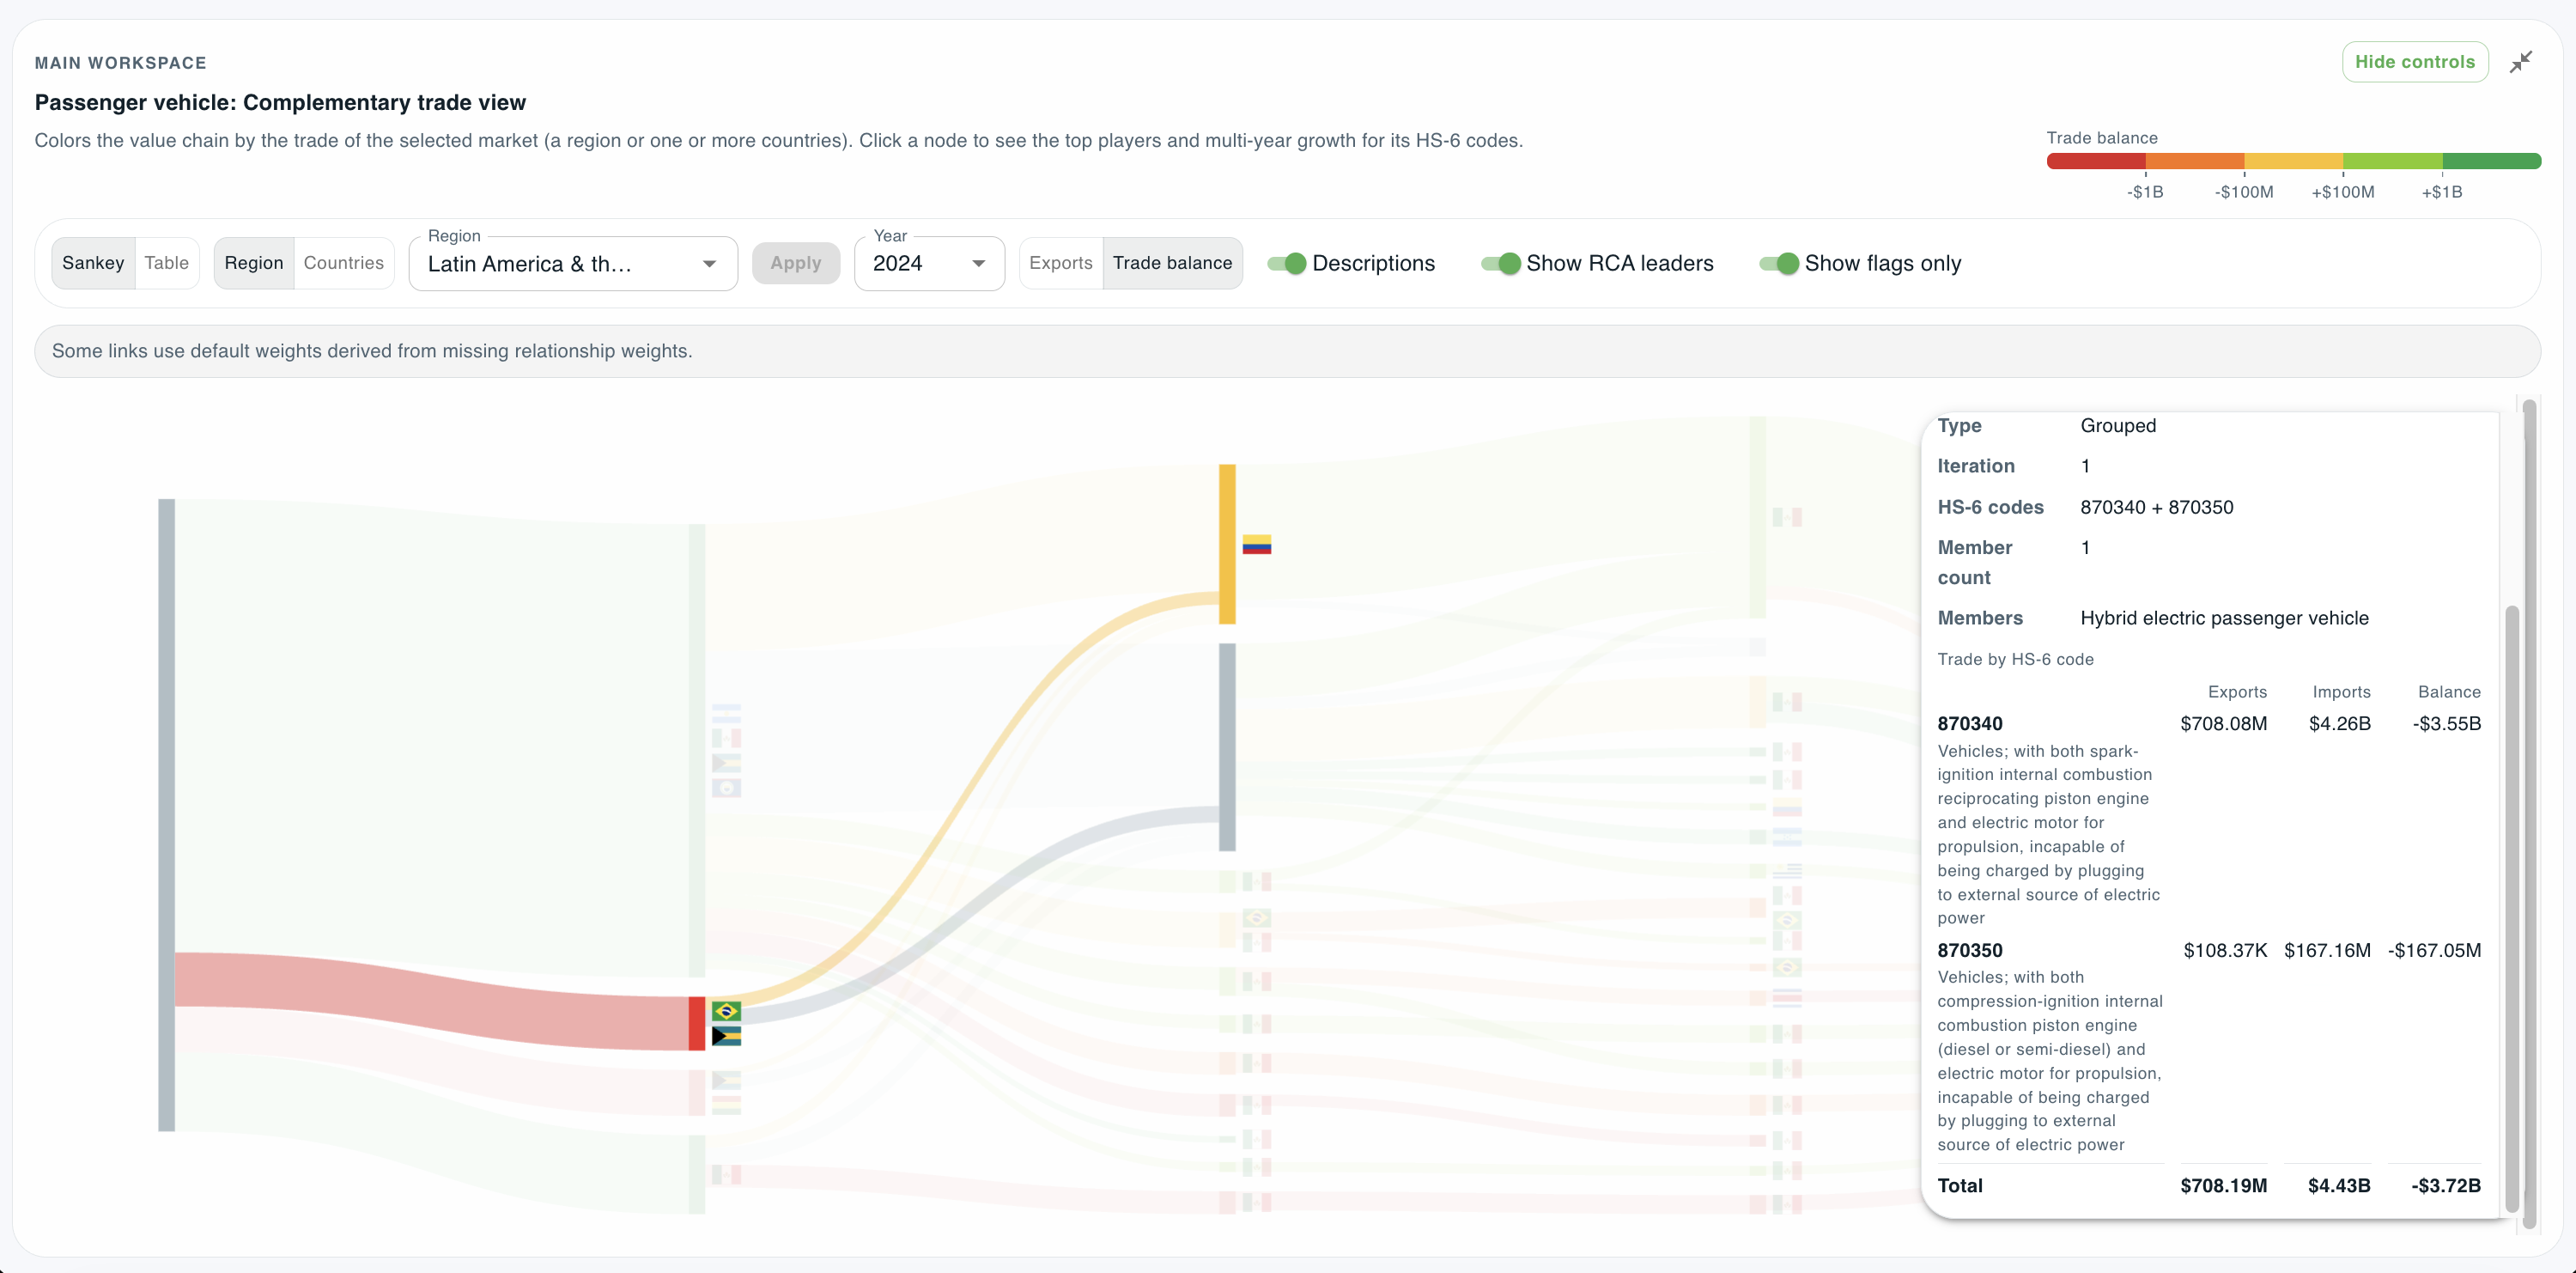
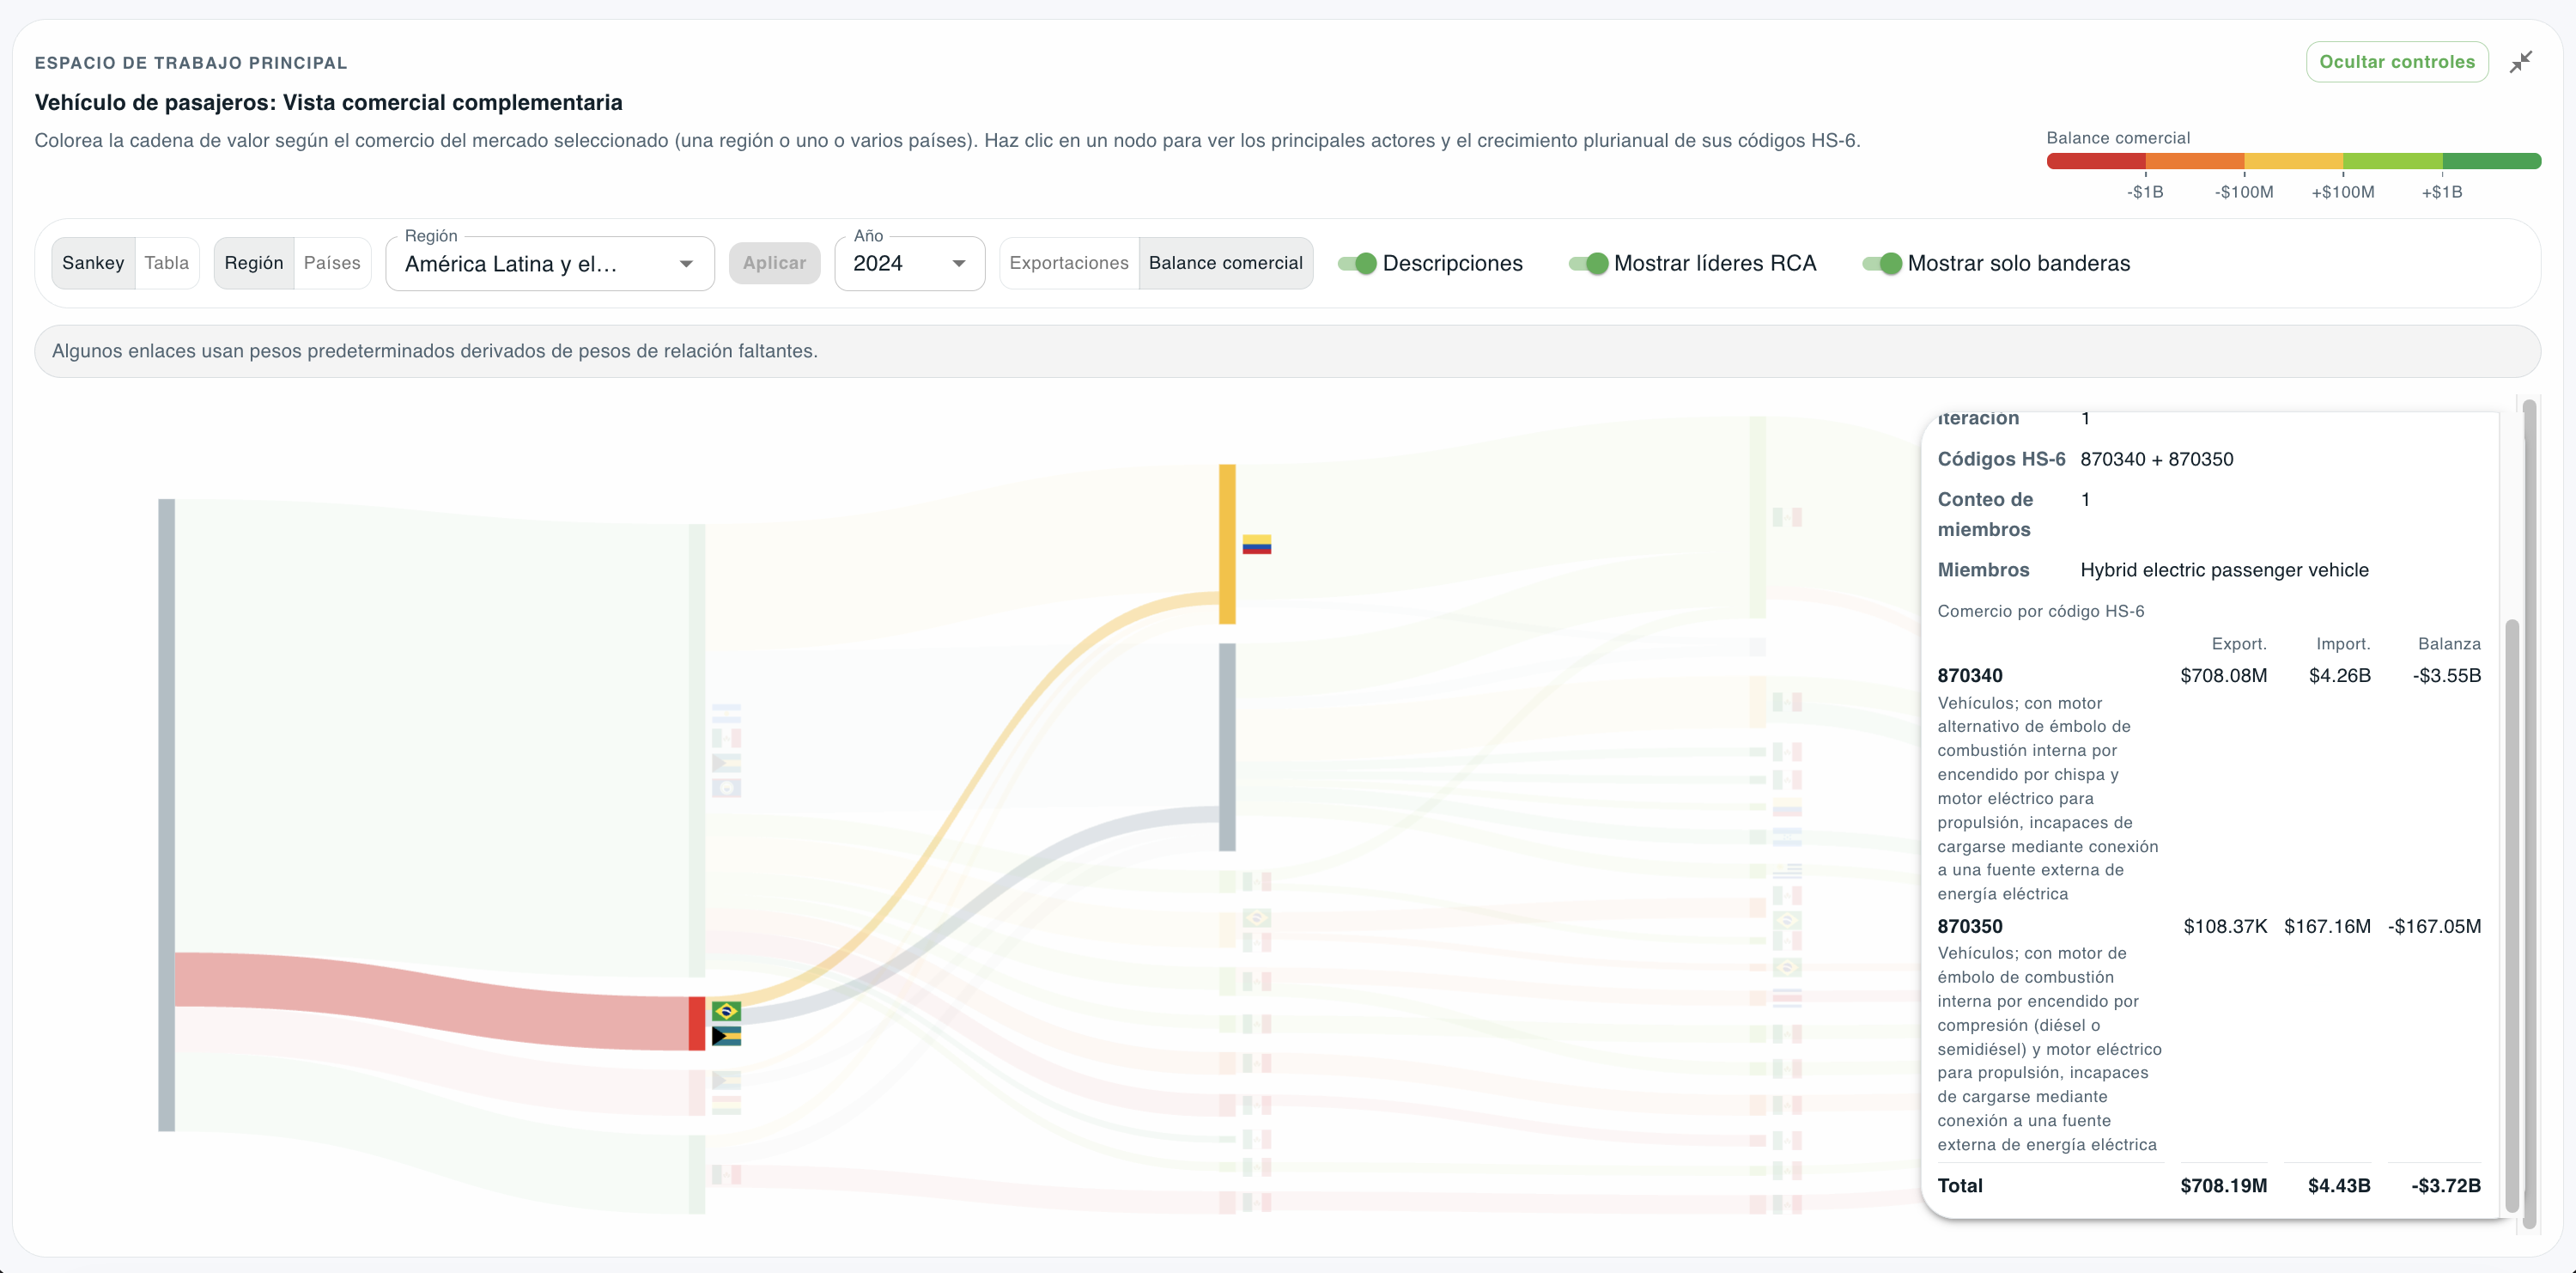
Open any node for its HS-6 codes with exports, imports and the resulting balance. 2 / 4 -
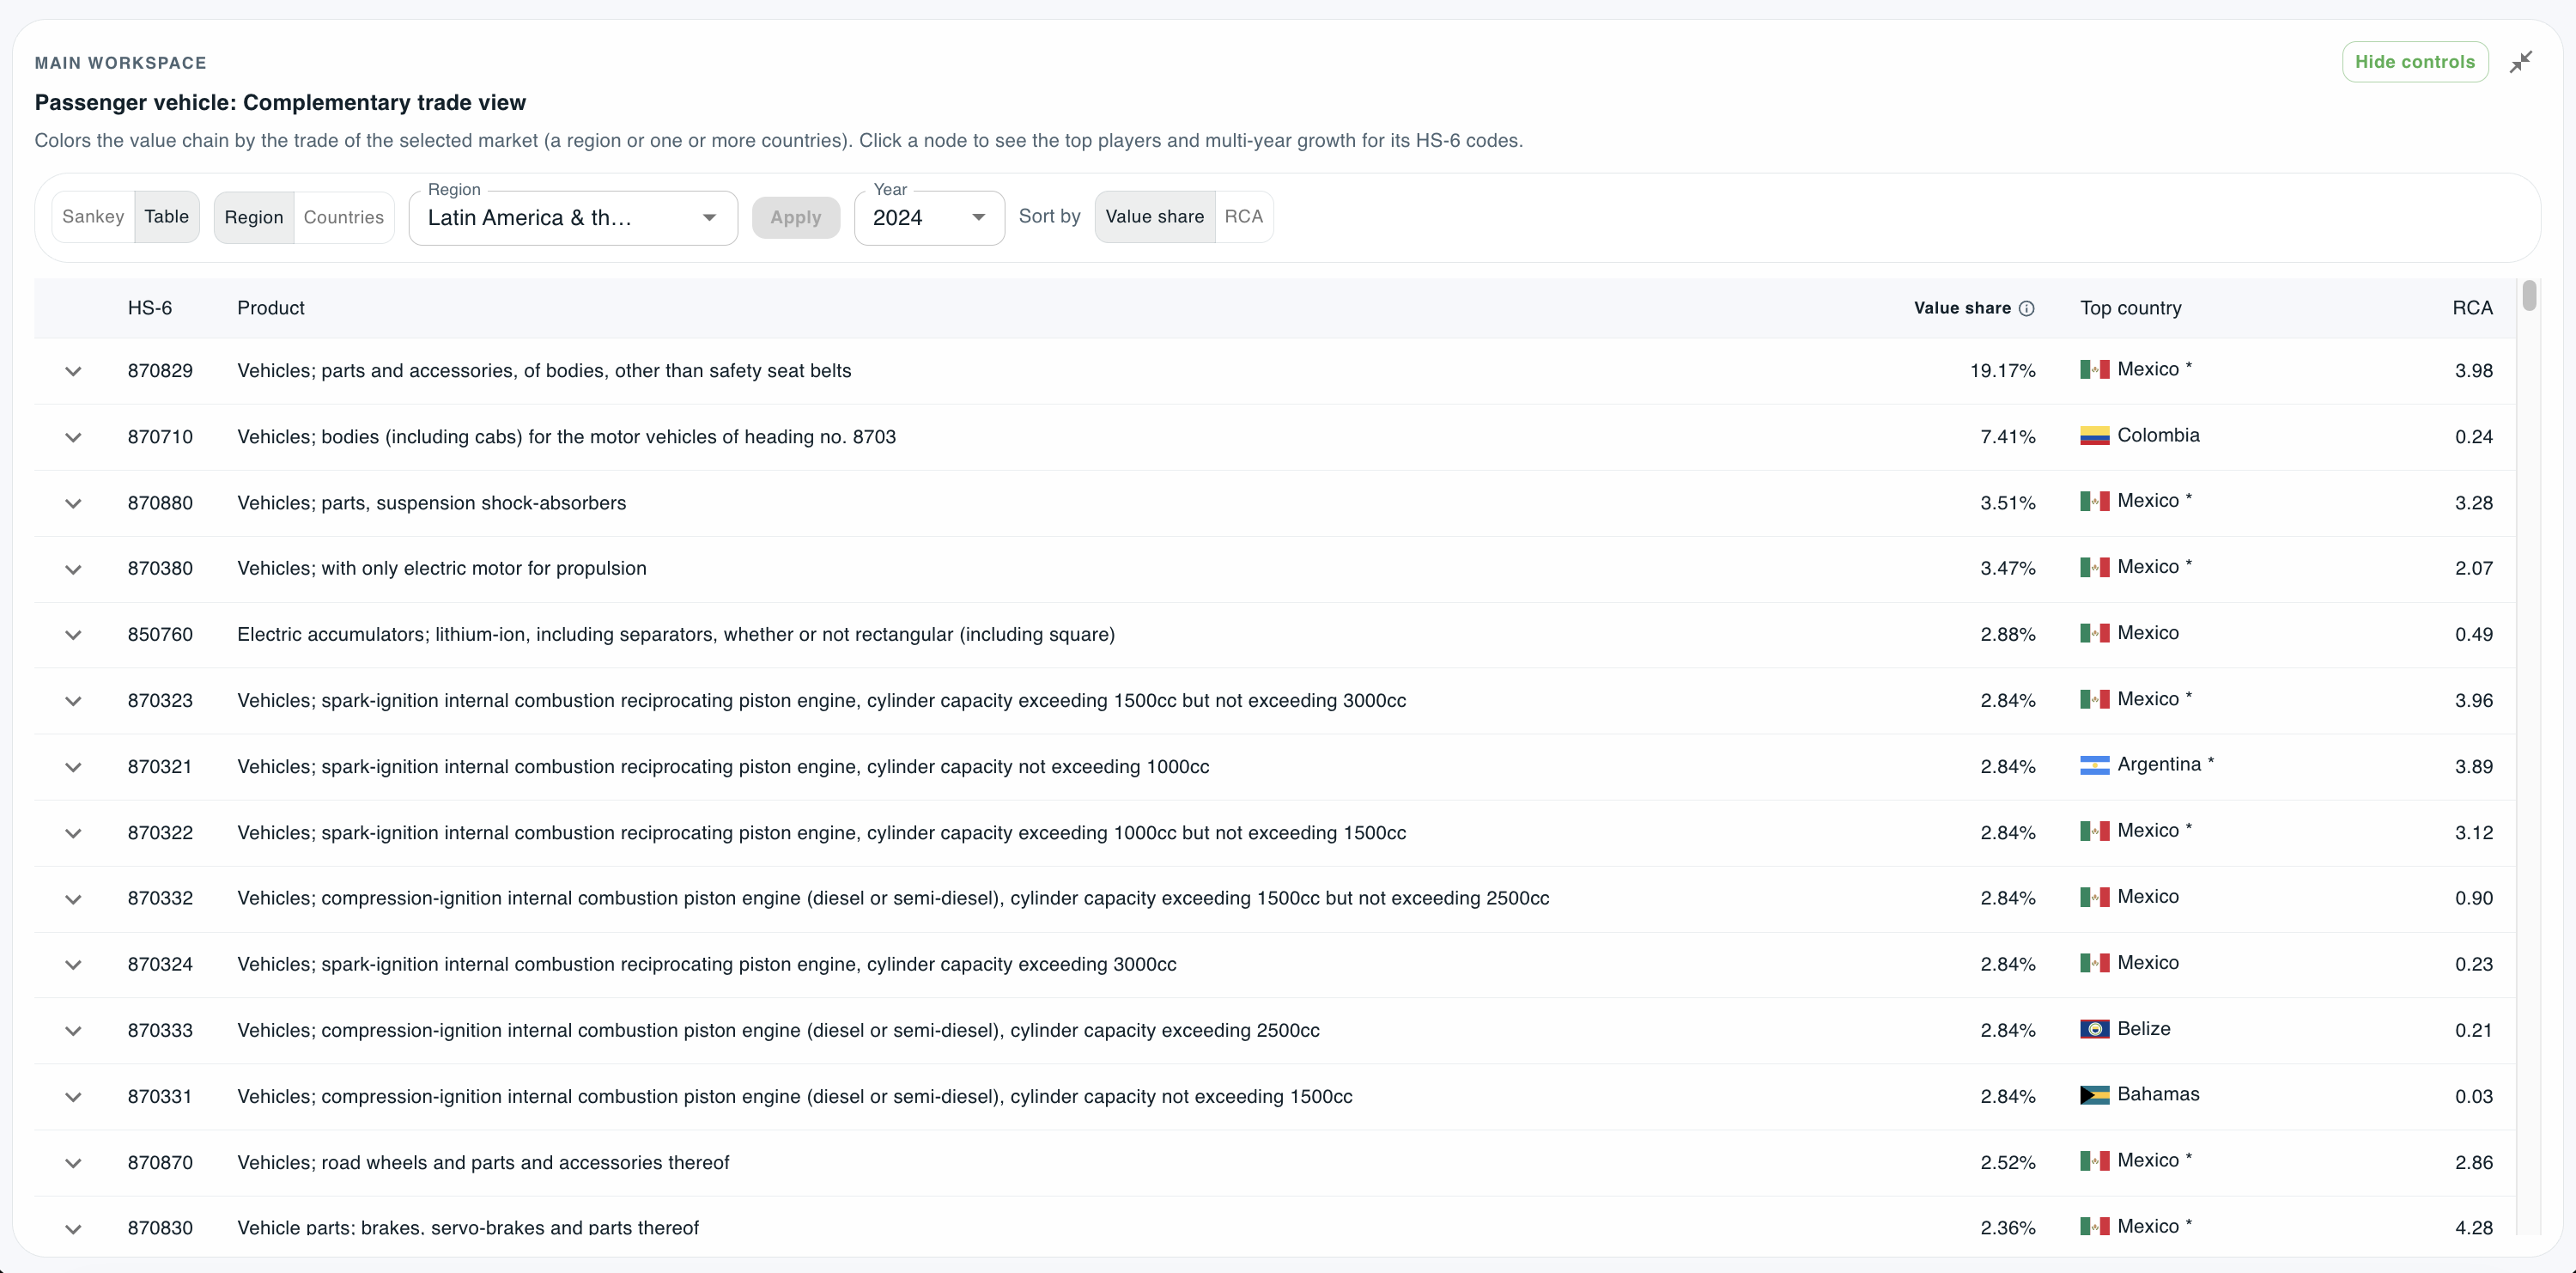
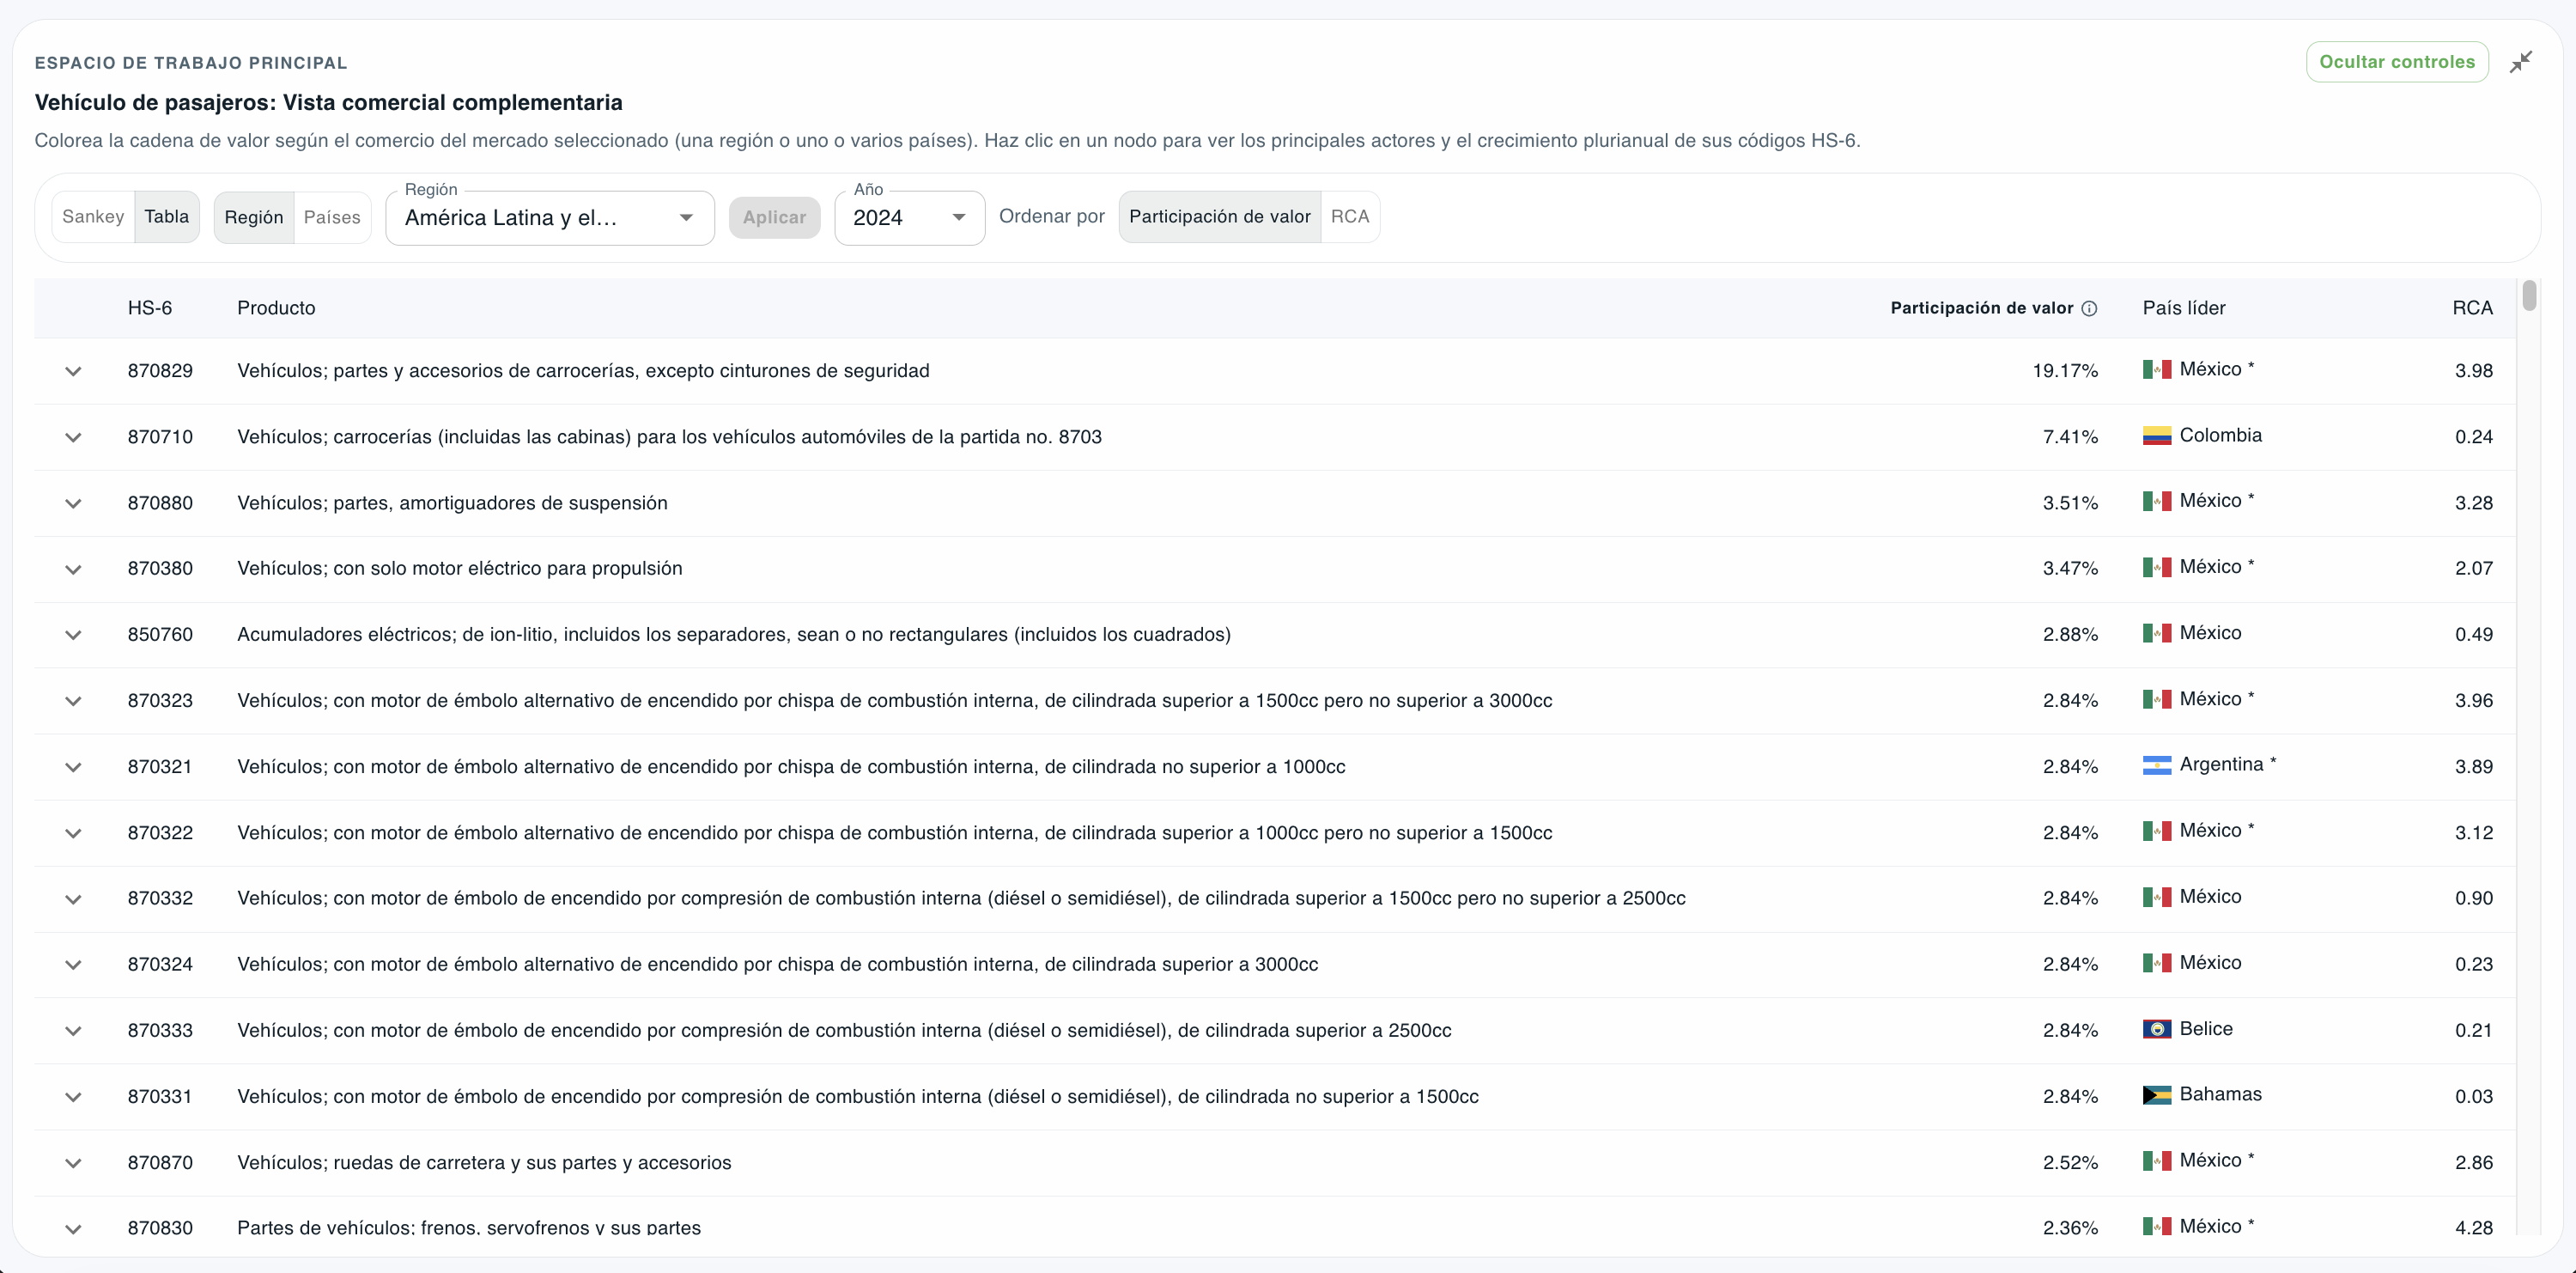
Table view: value share, top country and RCA for every HS-6 code in the chain. 3 / 4 -
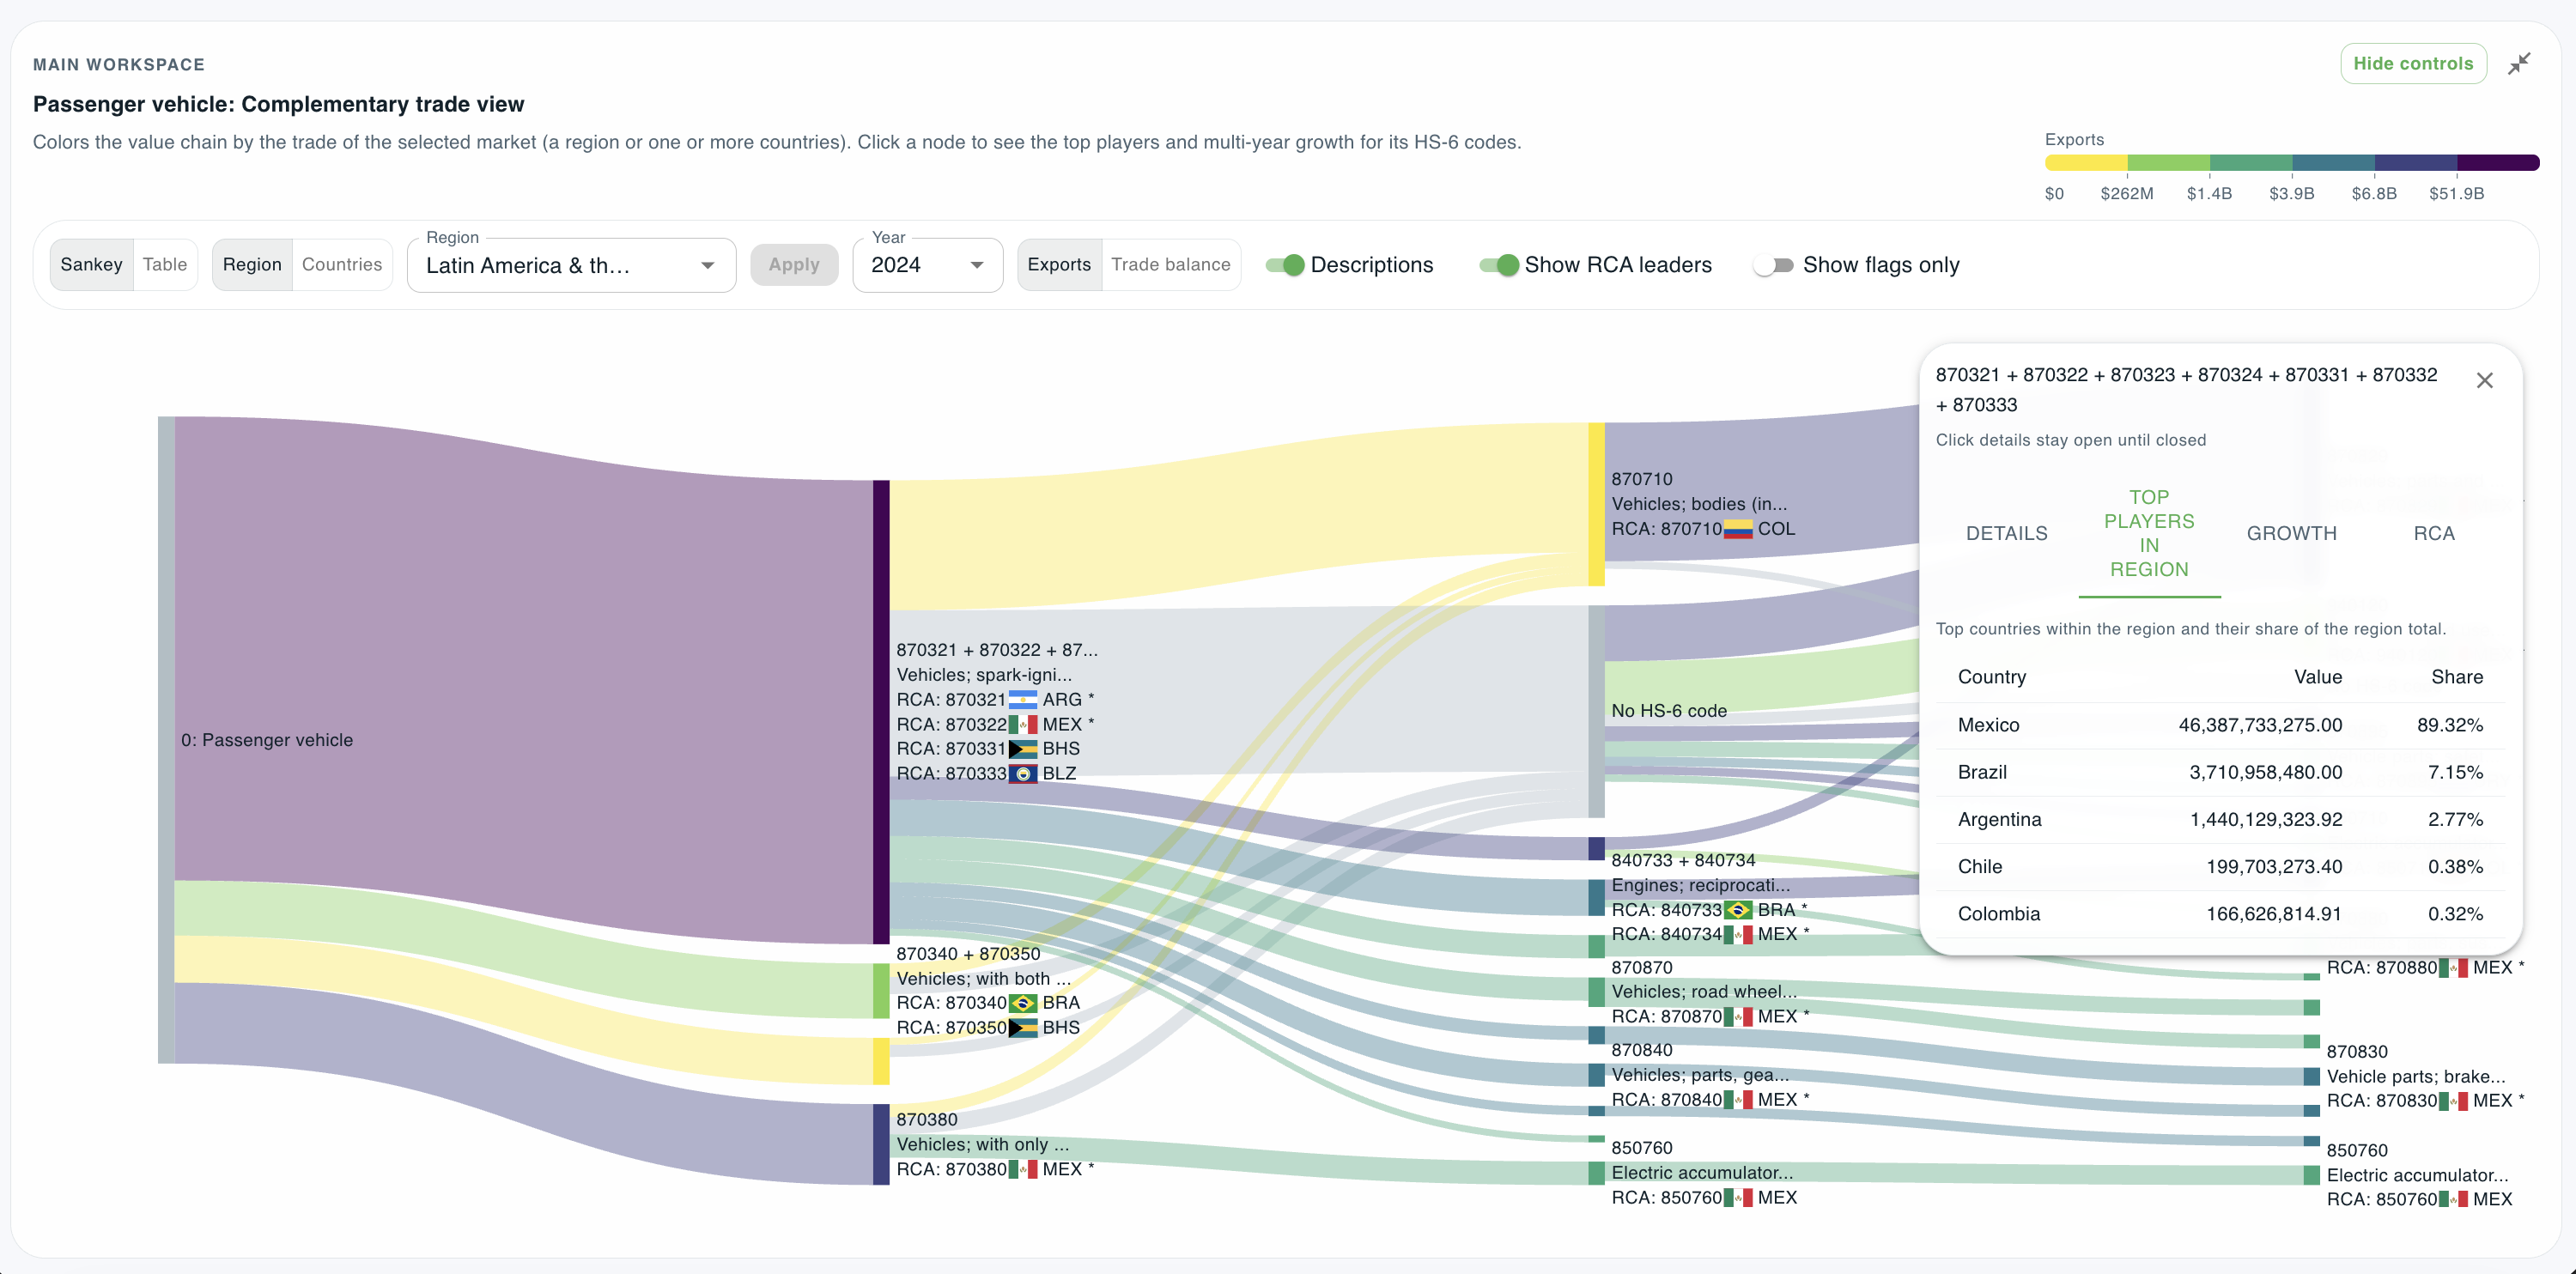
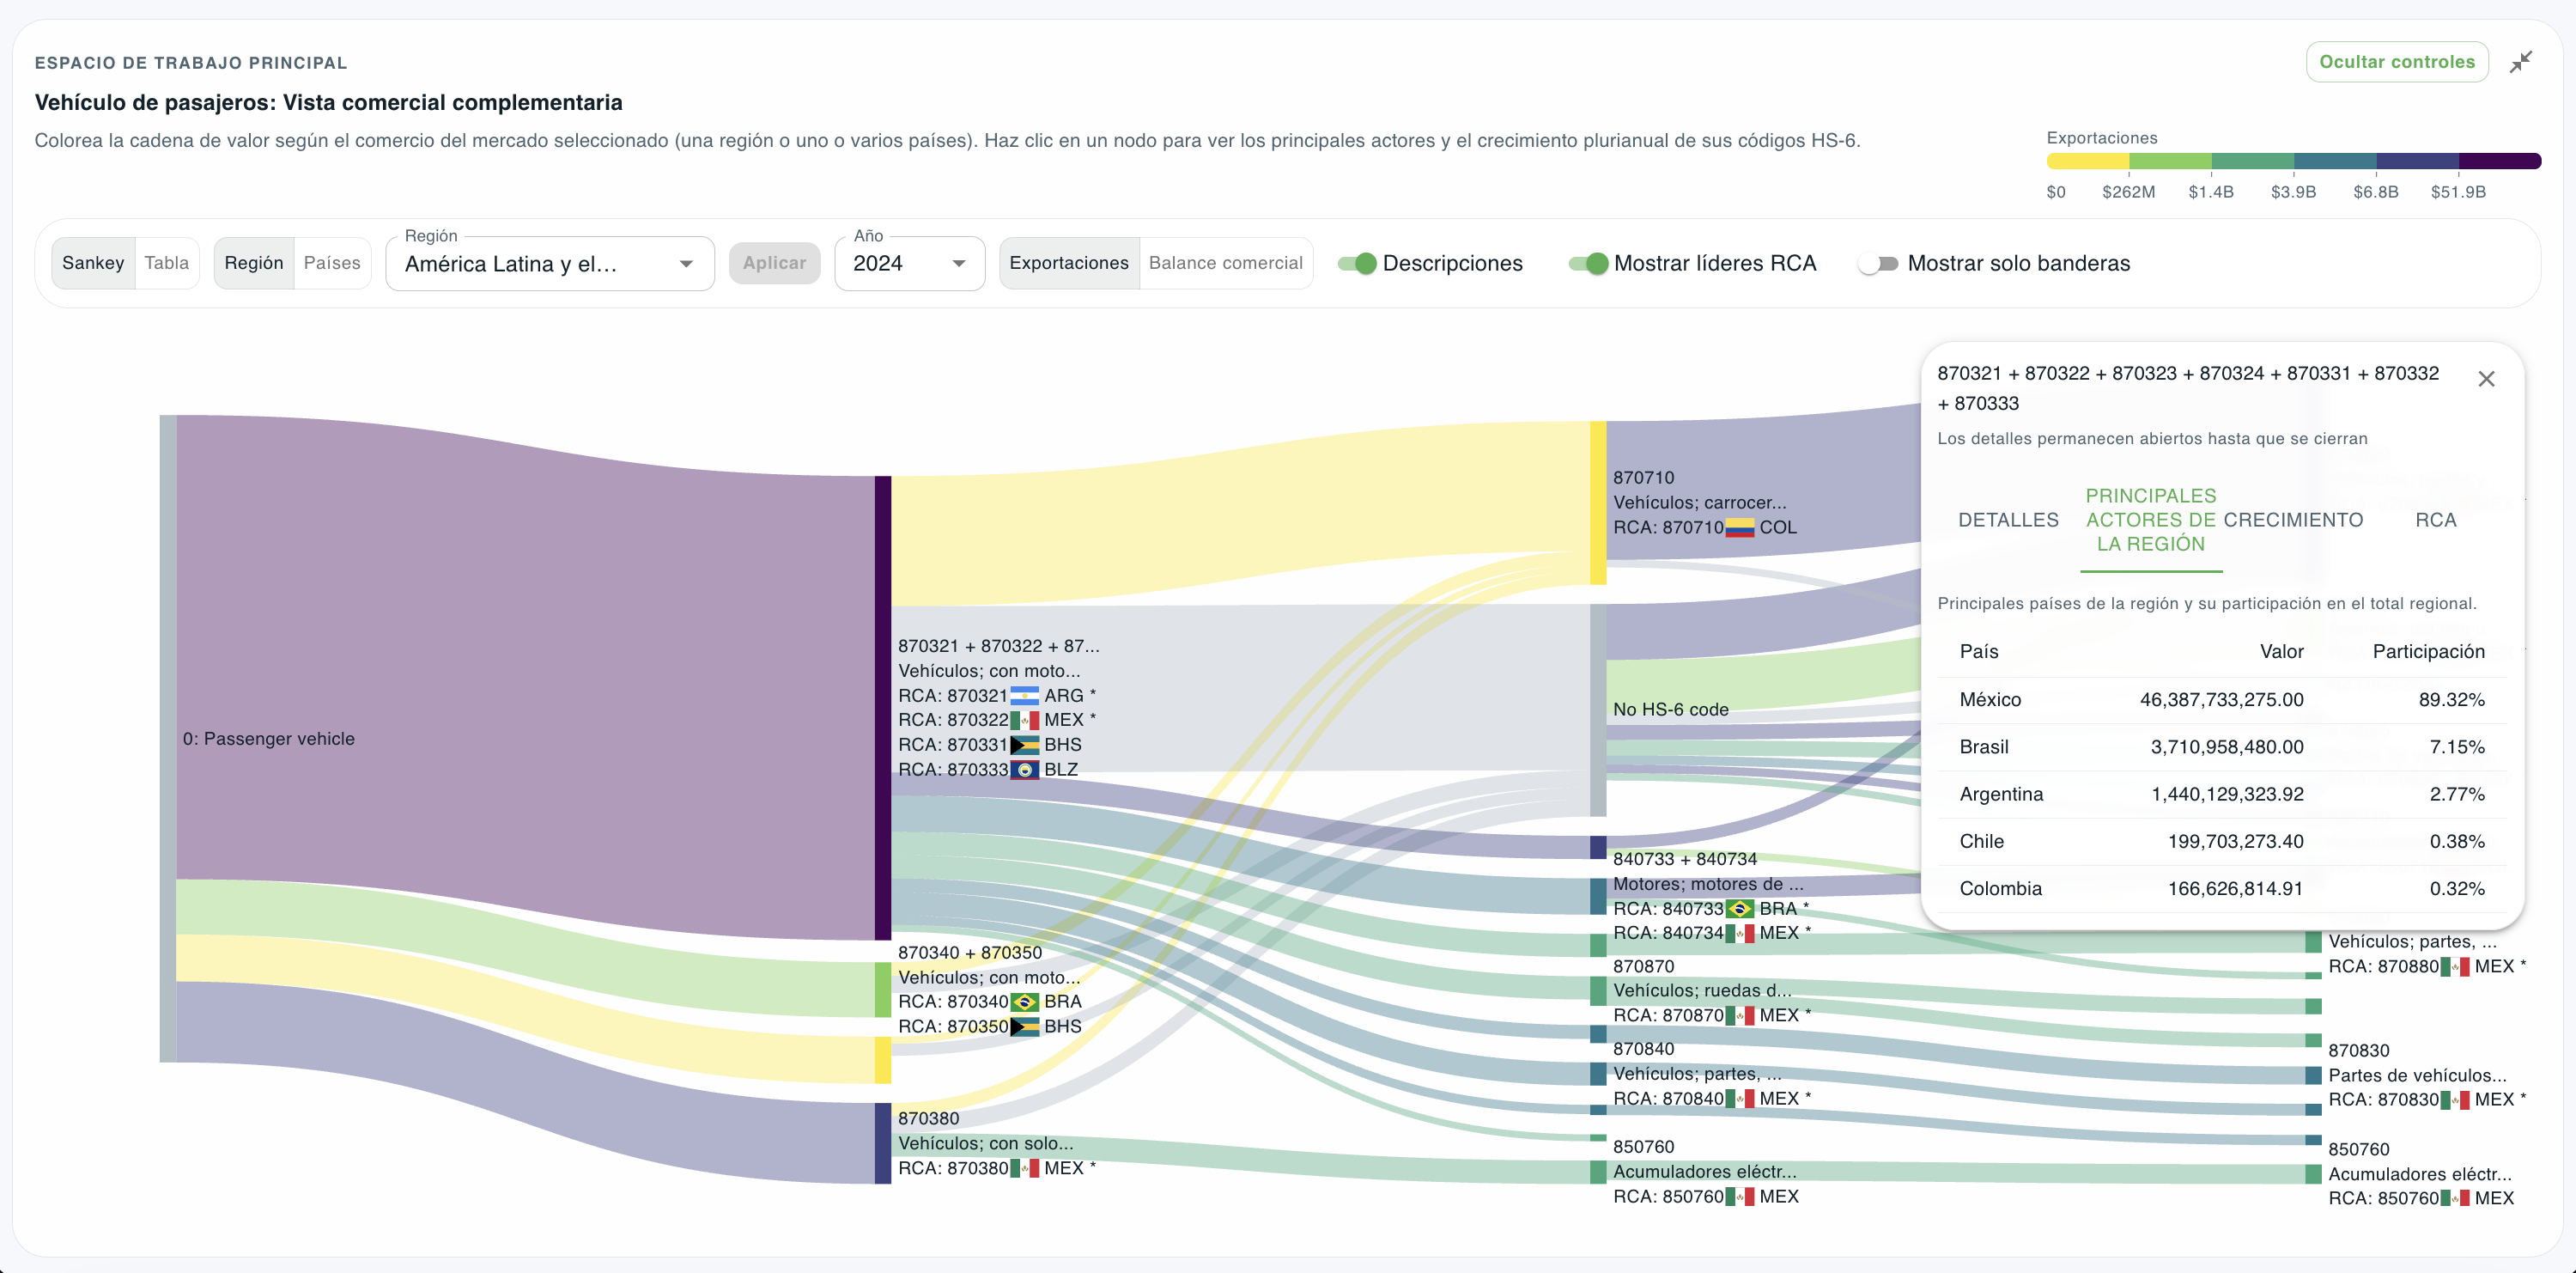
Coloured by export value, with the region’s top players ranked by share. 4 / 4
Insights for Regional Industrial Policy
In our ongoing collaborations with partners such as the European Union and the African Union, we build highly detailed bespoke datasets that map real productive capabilities — including firms — along critical value chains to inform industrial strategies at the regional level (read about our bespoke analytics here). These are only accessible to our project partners.
Our public Collaborative Value Chains Explorer maps our unique technological value chain decompositions to trade statistics to allow anyone to generate a range of useful insights.
Collaborative Strategies Beyond Regional Contexts
The Collaborative Value Chains Explorer also allows groups of countries that may not be regionally proximate to explore collective capabilities, complementarities, and dependencies, and to explore pathways for building collaborative value chains and trade relationships.
Use the dashboard to pick countries individually and create a bespoke “collaborative industrial strategy club.”
What you can explore
Each entry below explains one kind of analysis the Explorer supports, and what the underlying data can and cannot tell you.
Explore trade complementarities anchored in technological analysis
For each rigorously decomposed technological value chain, our dashboard allows you to explore which country exports which component with the highest level of specificity available in trade statistics. We visualize competitiveness proxies, like Revealed Comparative Advantage (RCA), and display regional exporters along each node of the value chain.
Bear in mind, however, that an inherent limitation of export data is that it does not distinguish between what is manufactured in the country and what is assembled there. Also consider that even the highest resolution trade classifications are highly aggregated, so a single trade code may map on to many technologically distinct value chain nodes (sometimes hundreds).
Explore collective current and potential export capacity
Even when countries merely assemble (rather than manufacture) their “exports”, the presence of exports may signal the potential to develop manufacturing capacity in a given value chain node.
Our explorer allows groups of countries to identify which strategic partners are likely to have export and production capacity in value chain nodes of interest, and allows the group to estimate their collective export and productive capacity to design coordinated export or industrial development strategies. While our bespoke tools allow more granular and high-fidelity assessment of current and potential productive capabilities, our public dashboard also provides useful approximations by mapping export data to our detailed technology graphs.
Explore regional trade balances along the value chain
View trade balances along each node of our rigorously decomposed technological value chains to explore value chain nodes where the region (or collection of countries) have collective strengths and weaknesses.
Identify technological import dependencies and avoid unnecessary duplications in addressing them
Explore collective supply chain vulnerabilities and dependencies by viewing import levels along each node of our rigorously decomposed technological value chains. High import dependency in important nodes can signal the need to develop new industrial capacities.
Identifying strategic potential partners within a selected group of countries can help coordinate joint productive investments and reduce unnecessary redundancy (“fallacy-of-composition” risks).
Begin to design procurement-led collaborative industrial strategies
The explorer can inform many types of collaborative industrial strategies. Collaborative procurement policy is one of the quickest ways to deliver results. By leveraging collective purchasing power, countries can aggregate and guarantee demand for firms, reducing risk and facilitating access to finance.
They can also use their purchasing power to negotiate favorable terms, such as the use of cleaner technologies across the relevant value chains, the incorporation of local value added, and technology transfer. For more detail on how to design collaborative procurement policy, read our papers: